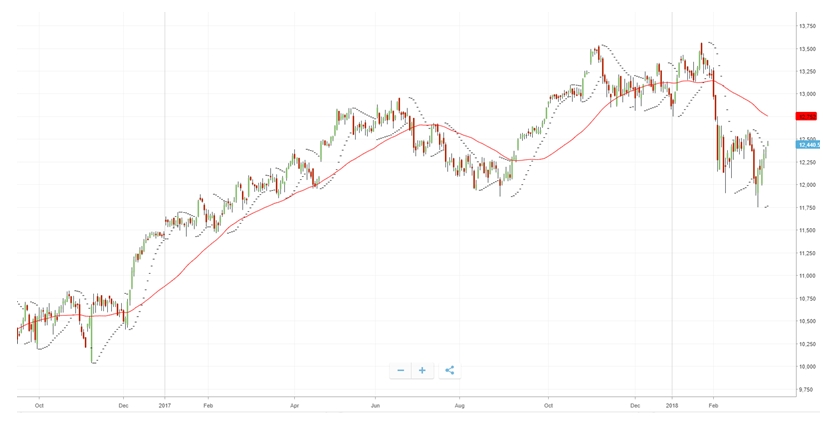
Parabolic SAR (Parabolic Stop and Reverse; also called PSAR) is an indicator, which can provide some very strong signals in a trending market, and the indicator is relatively easy to understand. At the same time, this indicator is ideal for use with other known indicators, such as moving average (EMA). Parabolic SAR is also included as an indicator in many trading platforms, such as Markets or eToro.
| At eToro you can trade 49 currency pairs, including several cryptocurrencies. Join eToro |
Parabolic SAR is used in particular to determine a new push in a market that is already trending, so that traders can come in early and make the most of the continued trend.
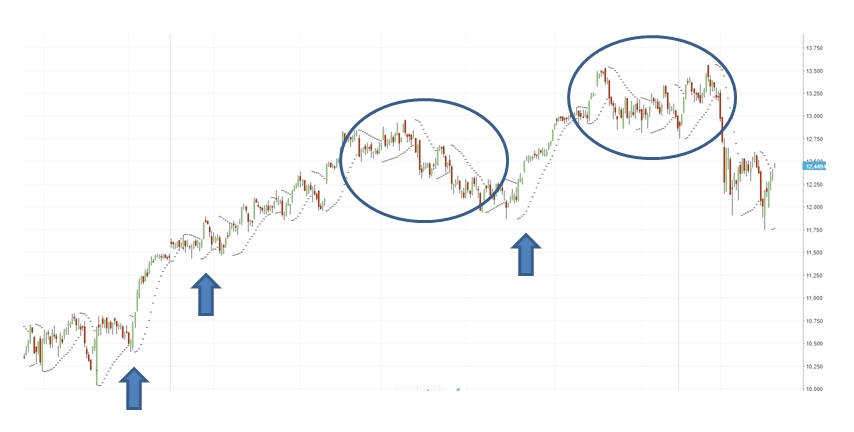
You can recognize this indicator by the line of dots that are either above or below the graph. If they are placed above the price of the asset, Parabolic SAR signals that it is a bear market (downward trend). When the dots are below the price, they signal that the market is moving upward. One can imagine that the dots act as a “ceiling” or a “floor” in relation to the price, where price doesn’t easily get over or under. And so, the indicator should be easily understood even by inexperienced traders.
Traders looking for a reversal should pay special attention when the dots from Parabolic SAR change – for example, from being under the graph to suddenly lying above it. This indicates a shift in the market’s direction, and the trader will typically seek confirmation from other indicators or from other time intervals, in order to confirm that there is really a trend reversal. You might want to read our interview with Jay Nemesis, an elite eToro trader, who also uses Parabolic SAR.
| At eToro you can trade 49 currency pairs, including several cryptocurrencies. Join eToro |
Parabolic SAR has been developed by the famous technical trader Welles Wilder, who is also the mind behind the RSI indicator, which is among the most used indicators. The actual calculations behind Parabolic SAR are relatively complicated, but you do not need to fully understand that as a trader. Most trading platforms – such as eToro – automatically draw this indicator on the graph if you want it. Parabolic SAR looks at the lowest or highest price of the period, and in each of the following periods the acceleration factor is assessed based on the graph trend. If acceleration stops and the price goes over or below the highest / lowest point of the previous period, the direction of the indicator changes, after which the dots change from top to bottom or vice versa.
Various studies have shown that proper use of PSAR can actually give a significant advantage over just holding a share over time. You can read, for example, this paper comparing three technical trading methods.


