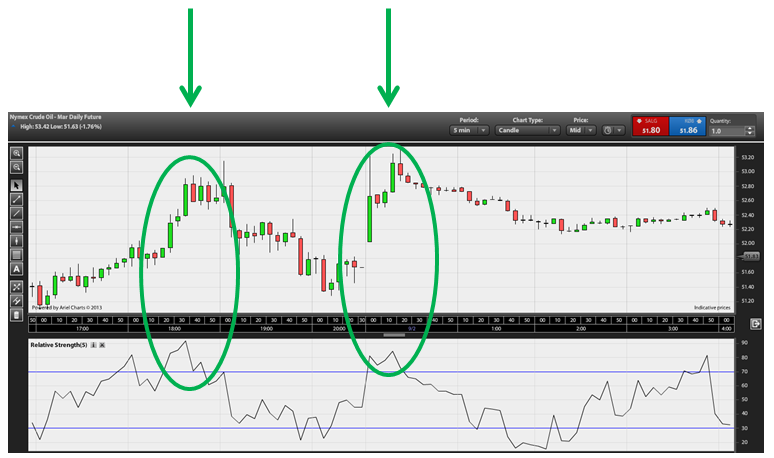
Relative Strength Index (RSI) is a momentum indicator that compares the size of the latest gains with the biggest loss in a given period. RSI is usually used to assess whether a market is overbought or oversold. Calculating RSI on a day graph is based on the following formula:
RSI = 100 – 100/(1 + RS*)
And here is RS = Average of x number of positive days / average of x number of negative days.
However, RSI can also be used on shorter graphs.

As can be seen from the graph above, RSI is in the range of 0 to 100. A market is considered by some to be overbought when the RSI comes up around 80 – meaning that the market may be slightly higher, and that there is an increased likelihood that the market will retreat. Similarly, it is said that the market is oversold if the RSI is below 20, and it may be an indication that the market may be underestimated and that an increase is possible.
| At eToro you can trade 49 currency pairs, including several cryptocurrencies. Join eToro |
If you use RSI as a trader, you should be aware that large increases and drops in prices can affect RSI and create fake sales and purchase signals. It is therefore best to use RSI as a supplement to other indicators or other elements of technical analysis; you should not act on RSI without looking at other factors as well.


